Email reports
The following are the predefined, out-of-the-box reports available for your email touchpoints:
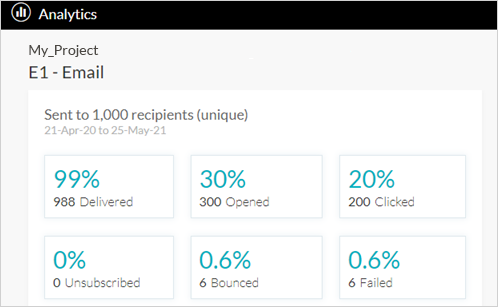
Key metrics
Key metrics are based on unique recipients. Each recipient is counted once regardless of how many times he/she performed that specific action. If the recipient opened the email three times on different occasions, he/she is counted only once in the Open count. Unlike the email performance doughnut chart, the totals are mostly independent of each other. For example, if a recipient opened and clicked, he/she is counted once in each total.
Circle Analytics calculates the metrics as follows:
-
The Open count is increased if the recipient clicked but there was no tracked open event (due to the fact that some clients block open event tracking). If the recipient clicked, we deduce that he/she must have opened the email.
-
The Click count is reduced if the recipient also unsubscribed. The click count represents success in the email performance whereas unsubscribe reflects the opposite. Circle Analytics cleans up the click count to better reflect the true success of an email.
|
Delivered |
The number
of emails that were successfully delivered to recipients. Note: Initially, the Delivered count includes recipients for whom delivery has not yet succeeded or failed. The system continues to retry delivery for these recipients, however if delivery fails, for example due to soft bounces, the delivered count is reduced and the bounced count increases. |
|
Opened |
The number
of unique recipients who opened the email. |
|
Clicked |
The number
of unique recipients who clicked a link in the email. The Click
count is reduced if the recipient also unsubscribed. The Click
count represents success in the email performance and unsubscribe
reflects the opposite. Circle Analytics cleans up the click count
to better reflect the true success of the email. |
|
Unsubscribed |
The number of unique recipients who unsubscribed or complained. Recipients who unsubscribed or complained are excluded from the open and click count. The Unsubscribe total includes:
The unsubscribe rate is the percentage of recipients who unsubscribed and made complaints out of total emails delivered. |
|
Bounced |
The number of emails that bounced. This could be due to:
The bounced rate is a percentage of bounced emails out of the total amount of sent emails. |
|
Failed |
The number of emails that failed to be delivered, and those where the delivery failed due to the recipient opting out prior to the send. Failure could be due to:
The failure rate is a percentage of failed emails out of the total amount of sent emails. |
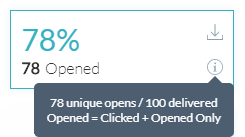
Hover over a metric and then
over the information  icon for further details. For
example, the Opened metric shows the number of emails that had been opened
out of the total delivered emails. You can also access the metric's list report by clicking
icon for further details. For
example, the Opened metric shows the number of emails that had been opened
out of the total delivered emails. You can also access the metric's list report by clicking  .
.
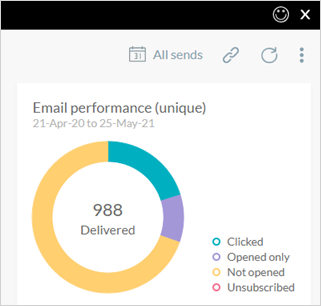
Email performance chart
The Email Performance report displays the statuses of a single email touchpoint in a doughnut chart, which represents the event types in a total of 100%.
Since this chart represents 100%, the report counts unique recipients (not events), and each recipient is counted in only one of the event groups according to his/her most significant event.
The events in order of significance are: Unsubscribe, Clicked, Open only, then Not opened. This means that if a recipient unsubscribed, opened the email and clicked some link in the email, he/she is only counted in the unsubscribe event group.
Link performance
The Link Performance report shows which links in the email performed best.
The report count is non-unique, meaning that each event is counted.
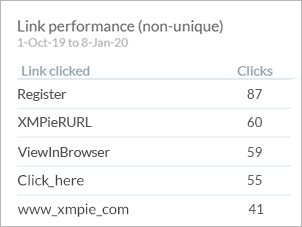
Circle attempts to automatically assign each link a tracking name. Links which Circle cannot name appear as "Unidentified". If you wish you may define your own tracking name using xmp-tracking-action.
Performance over time
The Performance over Time graph shows the number of opened and clicked emails for all sends or for the last send (as set in the date filter). This report shows non-unique open and click events. This means that if a recipient opened the email three times, three events will be shown. Hover over any point in the graph to see the open and click count for that point in time.
The initial view is of the first 24 hours. For mass email, the first 24 hours are of interest as they enable to establish the peak time that the email was opened.
Use the scroll bar below the graph to scroll and zoom to different time frames. You can also drag over an area of interest within the graph, such as a peak, to zoom into it.
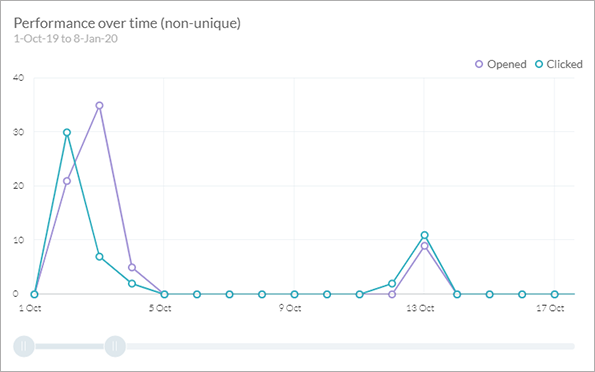
Note: The Performance over time report shows data of maximum one year. If you're interested in a date range of several years, set the date range for one year at a time.
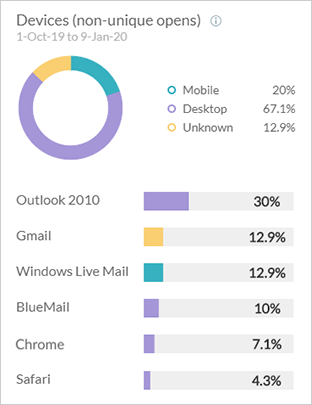
Devices and top clients
Prerequisite: XES Client 3.5
This report identifies the most popular devices used by your recipients. With this information, you can test your emails in the most commonly used email clients to ensure your emails display well in the different clients.
Each time your email is viewed on a different device, it may look slightly different. Each email client displays emails differently, thus the email needs to be tested in various clients. If you use Circle's email editor which handles responsiveness, it is likely that you will produce good looking emails in most clients, however you must still test your emails in the various clients.
Note that some devices are unknown because the email client blocks device detection (e.g., Gmail). These clients are classified as "unkown" because we don't know if they were opened on mobile or desktop.
Important note about device and geolocation reports
Device and geolocation reports provide an estimation only. Both reports depend on information collected about the recipient (the device and IP), which is then interpreted by a service we use.
The data is collected from the email client which the recipient uses to open the email. However, not all email clients allow passing this sensitive recipient information and block device and IP detection. One such email client is Gmail. This means that Gmail opens are not included at all on the map, and in addition, they are shown as "unknown" in the device reports since there is no way to know whether the email was from a mobile or desktop.
As a result, these reports may not be comprehensive, however they can still give you plenty of information:
-
Devices tell you on which email clients you must test your email. You won’t know if it’s Gmail mobile or desktop, but if the percentage is high enough, you should probably test on both mobile and desktop.
-
Geolocation may not give you all opens on the map, but you will get an idea of the spread of cities. This can help you identify which new areas to target, validate that your current targeting was successful, and for regions with different languages, you may find that you need to send a version in a different language.
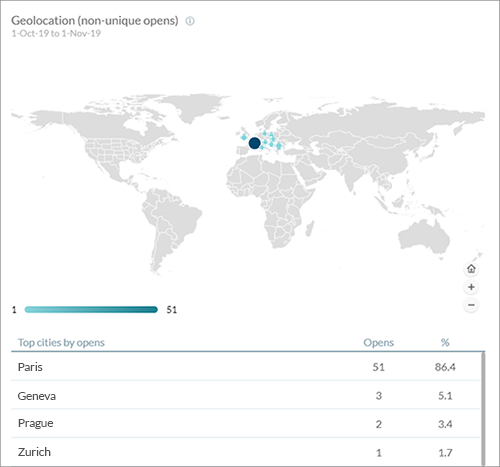
Geolocation
Prerequisite: XES Client 3.5
Geolocation approximates where your recipients are located, so you can target recipients in specific regions. Geolocation is an estimate based on IP address data only. We can’t pinpoint a recipient's exact location, but we can identify a general area.
Circle Analytics gathers geolocation data each time a recipient opens an email. The geolocation map shows a breakdown of non-unique opens by country, region and city.
This information helps you identify locations with a high open rate. You can use this information to target these top performing locations. On the other hand, locations with a low open rate may be your next target.
The amount of opens is represented by color. If you look at the legend below the map, you will see that the more opens, the darker the color. Click the map to zoom to the relevant area. Hover over a city to view the number of opens.
The Top cities by opens table lists the number of non-unique opens of each city.
Note that not every subscriber's email client can be detected, and some email programs don't identify themselves at all.