The date filter impacts the data displayed in the Analytics window.
You can limit data in the reports to show events which occurred during a certain time period (last week, month), or define a custom date range of your choice. You can also see data for all sends of the email touchpoint or just data from the last send.
Date filtering is especially useful when the email touchpoint has been sent more than once (e.g. an email with recurrence). This enables you to focus on the relevant period. For example, if you send a daily email, at the end of the month you may want to look at last month's performance.
Click the date filter icon ![]() located
at the top right corner of the Analytics window to display the date filtering
options.
located
at the top right corner of the Analytics window to display the date filtering
options.
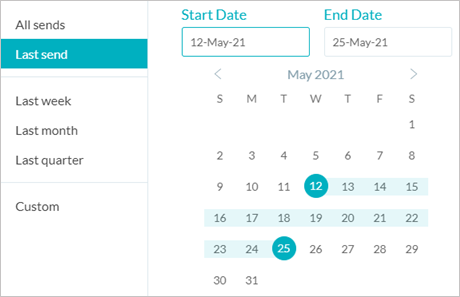
Select one of the following options:
● All sends - includes all sends from the first send to today, and all their events.
● Last send - includes only the last send and its events.
● Last week - includes events which occurred from Sunday through Saturday of the previous calendar week.
● Last month - includes events which occurred from the first to the last day of the previous calendar month.
● Last quarter - includes events which occurred from the first to the last day of the previous quarter.
● Custom - includes events which occurred during your custom date range.
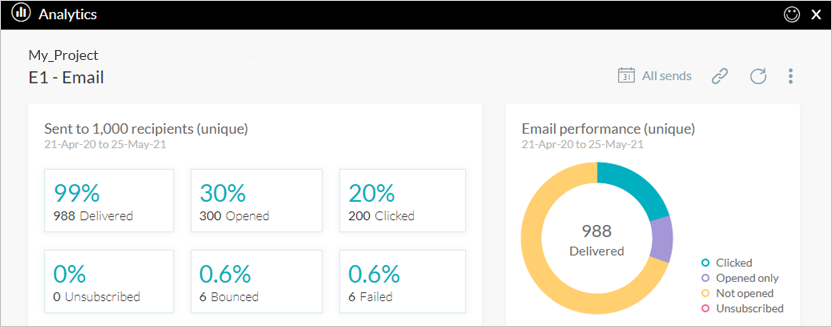
All sends and Last send return the results of a specific send(s). For example, if you send a monthly newsletter, you can look at the performance of the last newsletter.
In these cases, since the initial amount of recipients included in the send is known, the pie chart will show the percentage of the total, i.e. the percentage of recipients who opened the email.
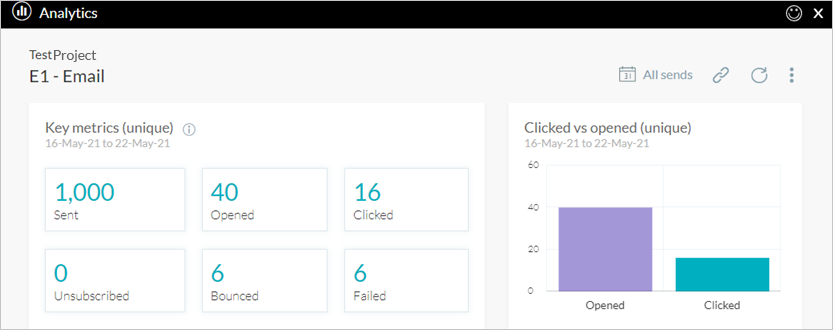
All other options - last week, month, quarter or custom date range - return results of a specified time frame, independent of the send which may or may not have occurred during that time frame. For example, if you sent an email on Monday and you select a time frame of Wednesday to Friday, there won't be any send events, but you may have opens and clicks.
In these cases, since the initial amount of recipients is unknown, the chart will not show percentages but rather absolute numbers.