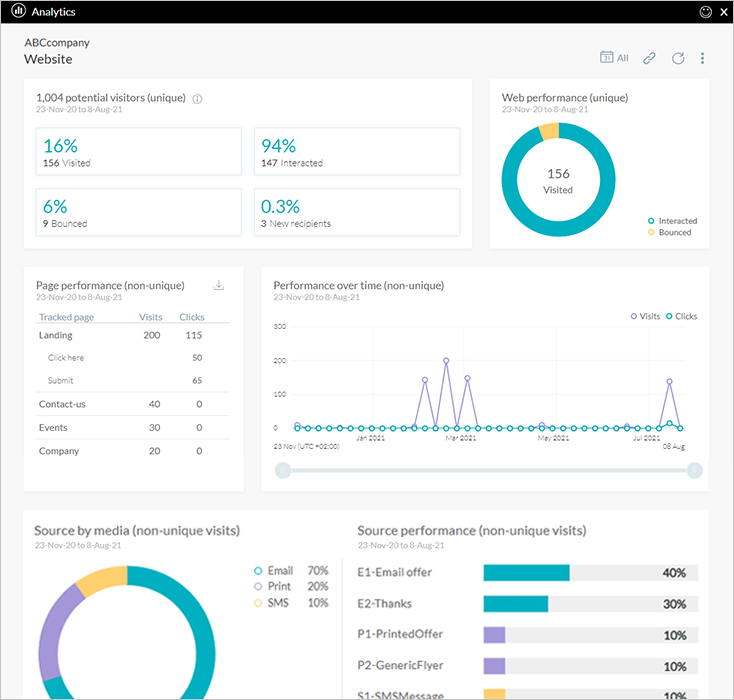
The website analytics window combines all tracked pages in a single view.
Clicking the Analytics icon ![]() above any
web touchpoint opens the same window, showing analytics for the entire website. In email and SMS,
on the contrary, the analytics window shows a single
touchpoint.
above any
web touchpoint opens the same window, showing analytics for the entire website. In email and SMS,
on the contrary, the analytics window shows a single
touchpoint.
Note that the title shows the text Website, as opposed to the touchpoint name, indicating that analytics of all website pages is displayed here.
 Only PURL pages and actions
which have XMPL tracking code are included in web analytics. For information
on how to add tracking code, click here.
Only PURL pages and actions
which have XMPL tracking code are included in web analytics. For information
on how to add tracking code, click here.
The following are the predefined, out-of-the-box reports available for your website:
Source by media and Source performance
Key metrics are based on unique recipients. Each recipient is counted once regardless of how many times he/she performed the specific action. If the recipient opened the webpage three times on different occasions, he/she is counted only once in the Visited count.
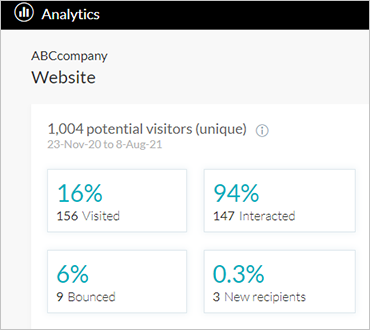
The title row of the key metrics shows the total number of potential visitors. This is a total number of people who were the recipients of an email, SMS or print sent as part of the campaign, as well as new recipients added via the campaign website. These recipients can potentially access the website using the link included in the email, SMS or print. This number of potential visitors is used to calculate the following key metrics:
Visited |
The number of website visitors. The rate is webpage visitors/potential visitors. |
Bounced |
The number of people who visited one tracked page and left without any further interaction, i.e. they hadn't navigated to a second page or clicked a button or link. The rate is bounced/webpage visitors. |
Interacted |
The number of visitors who interacted with the page, i.e. clicked a button or a link, or visited multiple pages. The rate is interacted/webpage visitors. |
New recipients |
The number of recipients who were added to the recipient list through this website, for example via the refer-a-friend form. This metric is particularly useful in projects which aim to increase the recipient list. The rate is new recipients/potential visitors. |
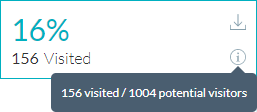
Hover over a metric and then
over the information ![]() icon for further details. For
example, the Visited metric shows the number of webpages that had been
visited out of the total potential visitors.
icon for further details. For
example, the Visited metric shows the number of webpages that had been
visited out of the total potential visitors.
You can also access the metric's
list report by clicking 
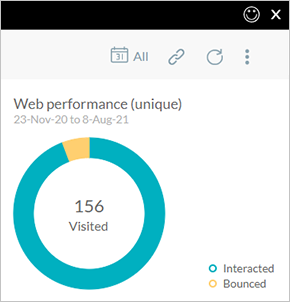
The Web performance report provides a quick view of the level of visitor engagement by visually comparing the number of visitors who left the website immediately after landing versus those who interacted with it.
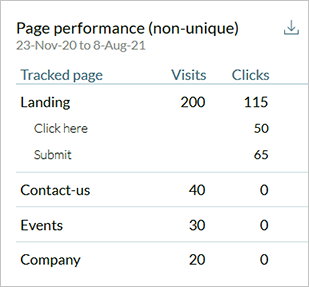
The Page performance report shows which pages in the website were visited, and the interaction within each page (Clicked column).
Note that only pages and actions which are tracked are included.
The report count is non-unique, meaning that all events are counted, regardless of the number of visitors who performed the actions.
Page performance list reports can be downloaded as a single file, containing all page performance events, or page-by-page.
The Performance over time graph shows the number of website visits and clicks for the entire time period. This report shows non-unique visits and click events. This means that if a recipient visited the website three times, three events will be shown. Hover over any point in the graph to see the visit and click count for that point in time.
Use the scroll bar below the graph to scroll and zoom to different time frames. You can also drag over an area of interest within the graph, such as a peak, to zoom into it.
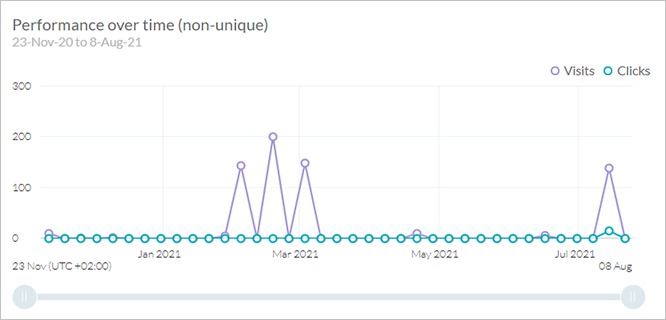
Note: The Performance over time report shows data of maximum one year. If you're interested in a date range of several years, set the date range for one year at a time.
The Source by media report shows the sources which referred traffic to the website. The source is the place users are before arriving at the website. It can be either an email, SMS, a print document or any other media of your choice, such as social media or webpage.
This report can help you assess which of your media performed best.
To achieve this, the URL should contain two tags, one defining the media (xmpmedia) and the other defining the source name (xmpsrc). You can use web ADORs, in which case this information is automatically added to the URL, or you can define it manually as in the following examples:
● https://mycompanydomain.com/mycampaign?xmpmedia=social&xmpsrc=facebook
● https://mycompanydomain.com/mycampaign?rid=MyRecipientKey&xmpmedia=Web&xmpsrc=CompanySite
Web ADORs contain source and media information for email, print and SMS touchpoints. If you're using social, web or other media types, define the source and media manually.
For more information, see Cheat sheet for web.
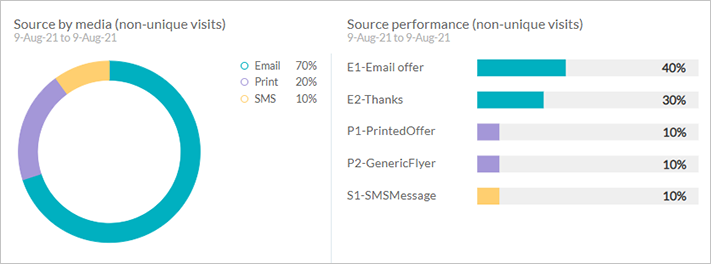
The Source performance report provides a detailed breakdown of each media by touchpoint name or source. For example, you can assess which of your touchpoints performed best by contributing to the number of visits.
Notice that the color of the bar chart in the Source performance chart corresponds with the color of the media in the Source by media chart.
In order for the source and
media of print touchpoints to be tracked and displayed in Circle analytics,
production of the print must be done in Circle (not in uCreate Print or
uProduce).