Adding Charts to uStore Reports
Summary: This article describes how to add charts to uStore reports.
Audience: XMPie customers wishing to add charts to uStore reports.
Prerequisites: Knowledge of XMPie products and Microsoft Excel is required to create charts for uStore reports, but no additional knowledge is required for this walkthrough.
Overview
Sometimes it is easier to get an overview of a report by visualizing the data with a chart. In this walkthrough, we will add a chart to the Order Item Listing uStore report.
Advanced Charting
uStore does not use Excel to display reports within the uStore Back Office, therefore the charts will not appear in the Reports tab in uStore.
If you wish to add charts to the Reports tab in the uStore Back Office, you can contact XMPie Professional Services.
XMPie Professional Services is a contract service offered to our customers that require custom integrations or solutions.
Creating a Chart
In this walkthrough, you will create a chart to visually display some of the details in the Order Item Listing Report. The details we will display are the Product Names and the Total Order Price. By using this chart, we will be able to see at a glance which uStore products are raising the most revenue in a particular store.
To create a chart:
-
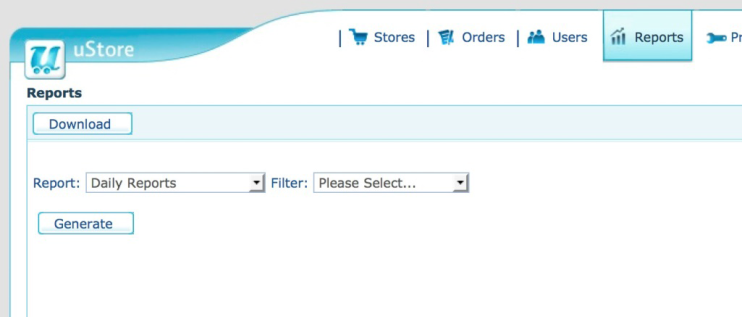
To start the chart creation process, log into the uStore Back Office and go to the Reports tab:
-
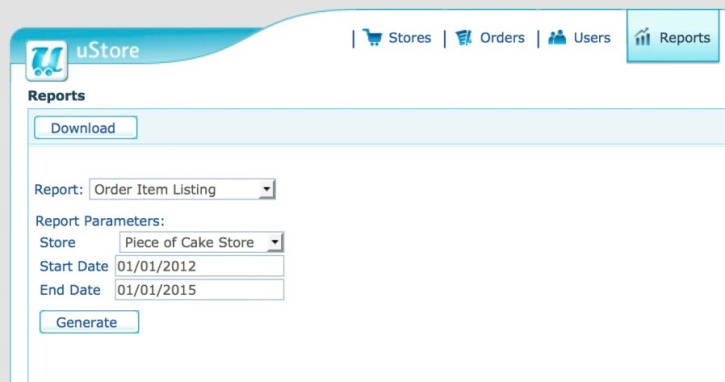
Select the Order Item Listing report; choose a store and a date range:
-
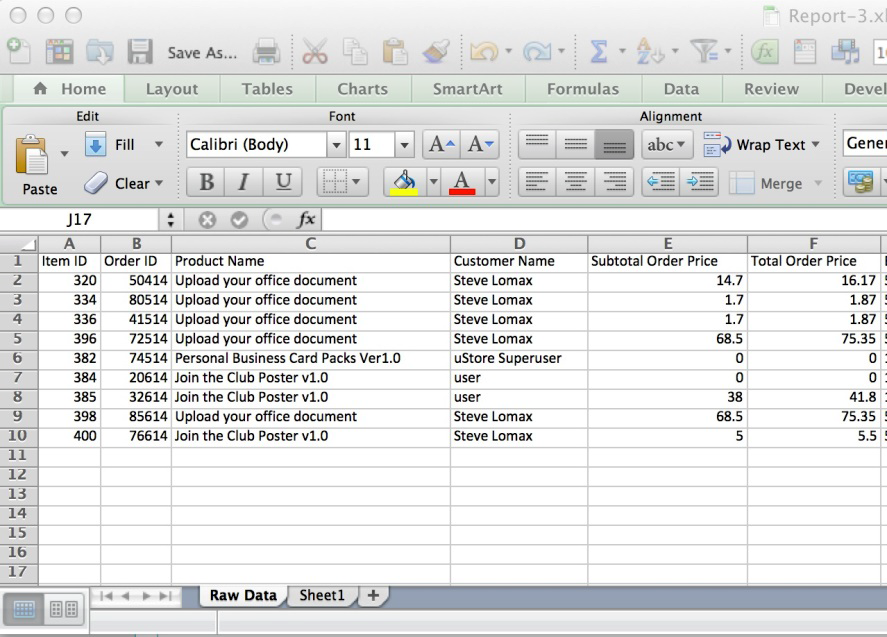
Download the report and open it in Microsoft Excel:
-
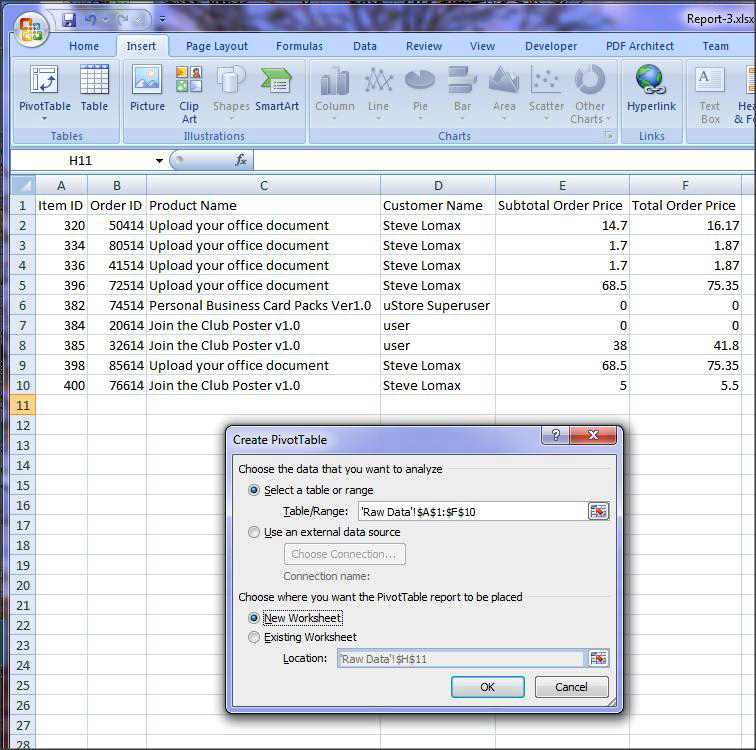
Within Excel, insert a PivotTable, choose the data you want to appear in the chart and add it to a New Worksheet. We want to see which products are generating the most revenue in our store, so we choose a data range that includes the Product Name and the Total Order Price:
-
Drag the Total Order Price into the Sum Values pane in the PivotTable window:
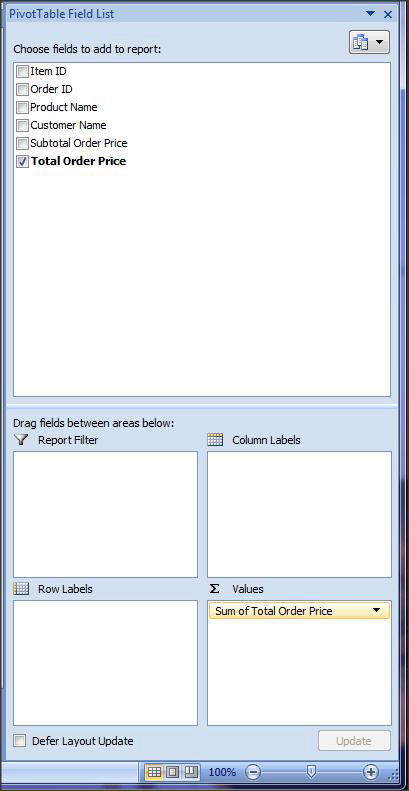
-
Select Sum of Total Order Price and in the Show values as field select % of total:

-
Drag the Product Name field into the Row Labels pane in the PivotTable window:
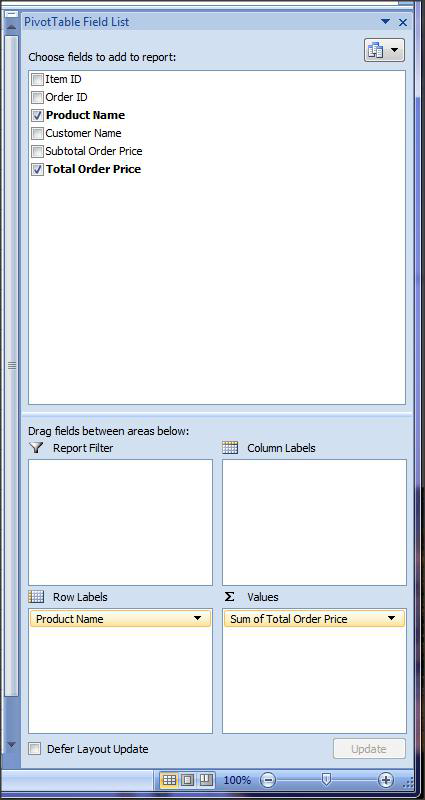
-
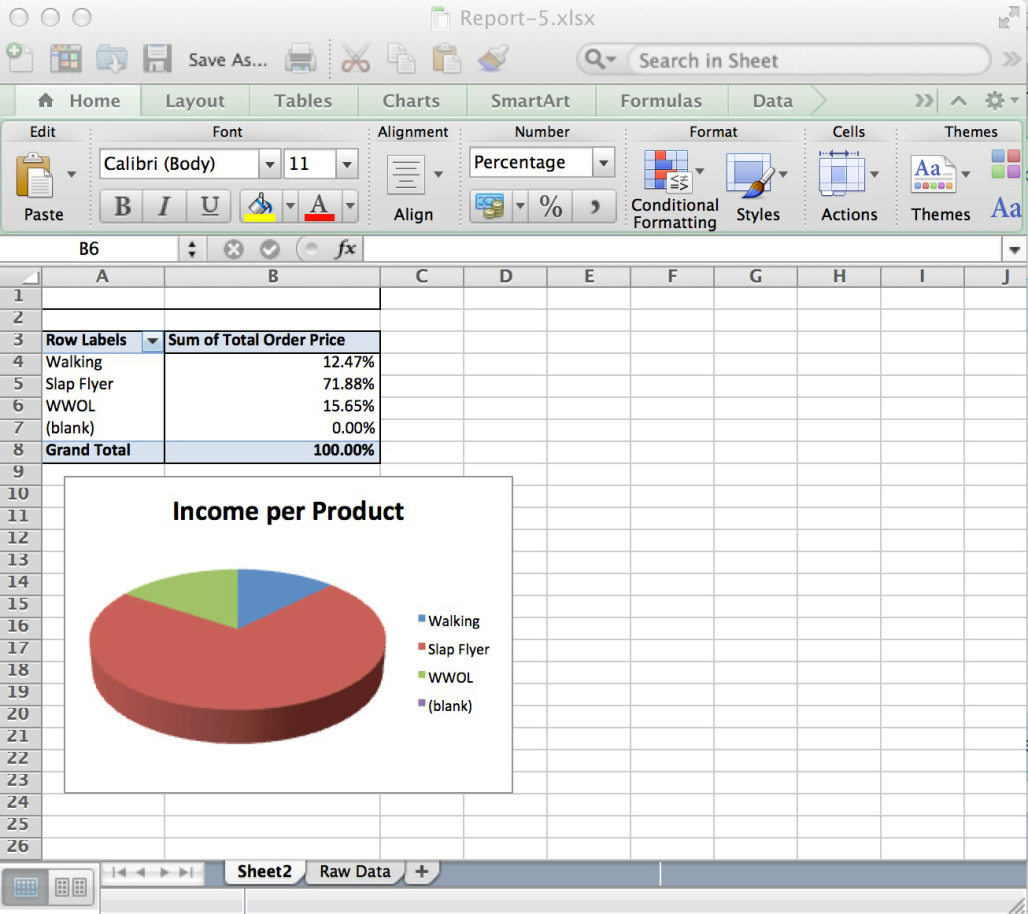
Select the data and insert a chart. In this walkthrough, I chose a 3D pie chart:
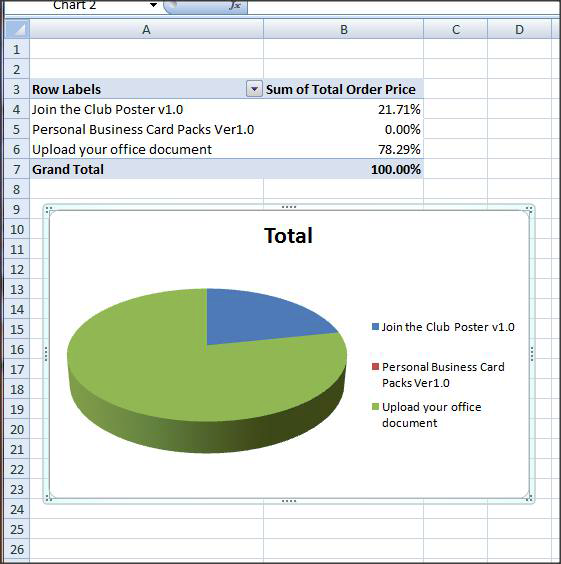
-
Rename the chart title, remove unused sheets and save the chart:
-
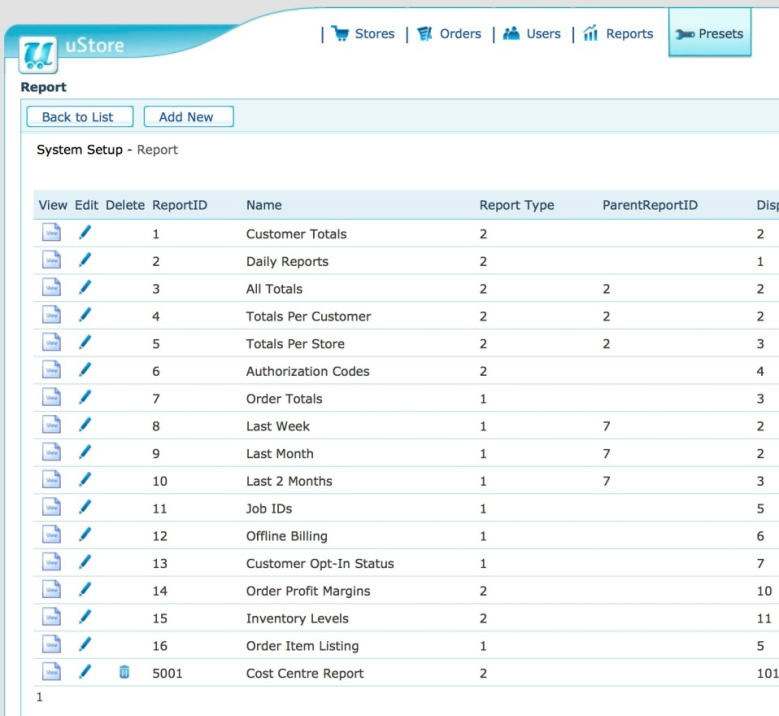
Go to the Report table in the uStore Back Office by clicking on Presets > System Setup > Report and take note of the ReportID for the report you are creating the chart for. In this walkthrough, the ReportID is 16:
-
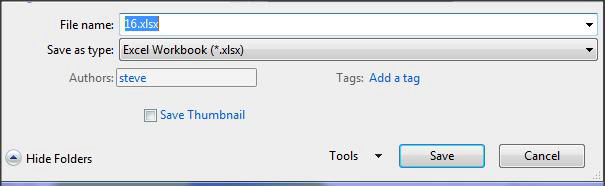
Save the newly created Excel file with the ID of the report. For example, save it as 16.xlsx:
-
Browse your network to your XMPie server and copy the Excel file into the uStoreShared\ReportTemplates\ folder.
Accessing the Modified Report
You can now test the modified report by accessing it via the uStore Admin “Reports” page. The modified report will be available via the “Report” drop down list under “Order Item Listing”.
You will not see the chart in the report that is presented to you on the uStore Reports page, as uStore does not use Excel to present the tabulated data.
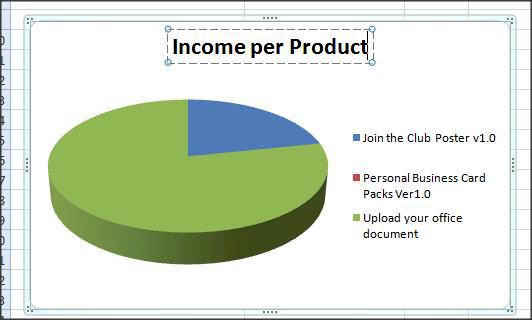
Download the report and open it in Excel. The new chart is shown, and it is using the latest data:
Created by: Steve Lomax, last updated: July 2, 2014