Monitoring uProduce system
uProduce allows you to monitor the status of your system. Clicking the Monitoring button on the navigation bar allows you to view the system status. This button is only visible to the users who are granted permissions to view the monitoring information (see Setting up user permissions for monitoring).
The following monitoring tools are available:
-
Disk space monitoring tool
-
Database size monitoring tool
-
Services monitoring tool
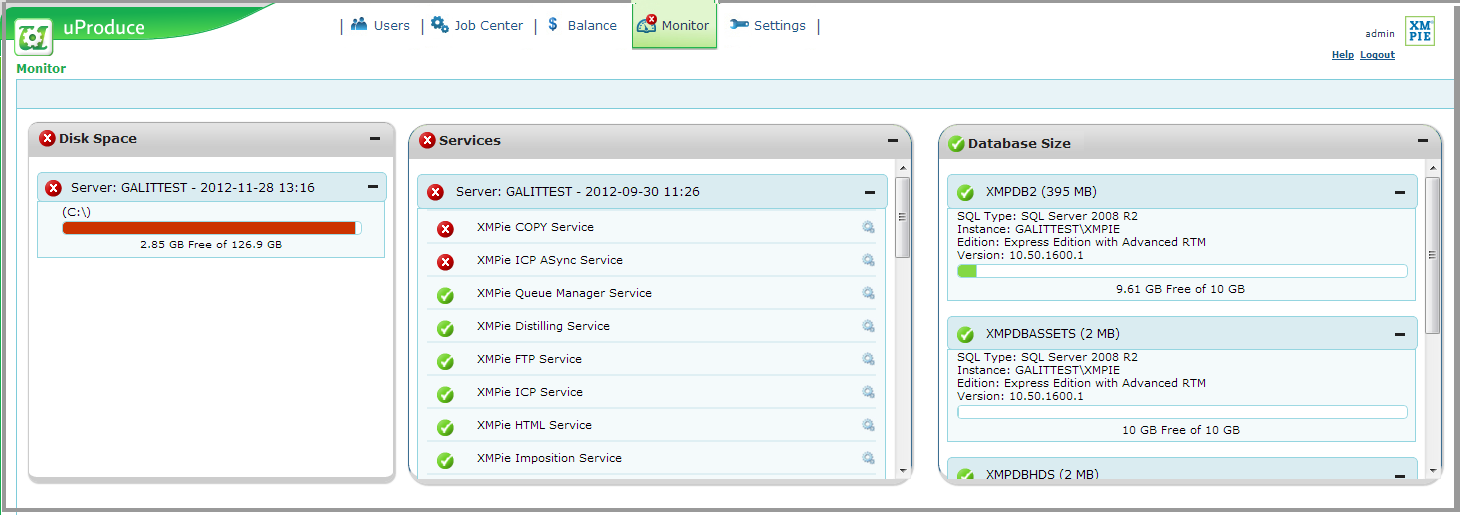
An icon representing the overall status of the uProduce system appears on the Monitoring button. The overall status is the same as the most severe status of one of the monitoring tools. For example, if only one tool reports an error whereas all the other tools display the “OK”status, the overall monitoring status will be “Error”.
The status indicators for the monitoring tools can be one of the following:
|
Icon |
Option |
Description |
|---|---|---|

|
OK |
Displayed when the system operates as expected. |

|
Warning |
Displayed when the system functions properly but there is a non-critical issue that the administrator should address. A warning email notification is sent to the administrator. |
|
|
Error |
Displayed when there is a critical issue that the administrator should address. An error email notification is sent to the administrator. |

|
System Error |
Displayed when a monitoring tool did not report at a scheduled time. This status provides information about the monitoring tool itself as opposed to other status indicators that refer to a monitored parameter. An error email notification is sent to the administrator. |
When one of the monitoring tools reports an error or a warning, an email notification is sent to the administrator. To learn how to set up the email notification mechanism, see Email notifications for uProduce system alerts).
Disk space monitoring tool
An increase in data volume stored on a computer disk causes the application to perform less efficiently. Running low on disk space may cause performance issues and even production failure.
The Disk Space monitoring tool notifies you about the amount of available disk space and issues alerts when the minimum disk space threshold is reached.
-
Warning: 30GB of free disk spaces remains available.
-
Error: 10GB of free disk spaces remains available
The available disk space is indicated for each one of the XMPie servers and detailed per disk. The disk space usage is indicated with respect to the available disk space (for example, 26.24 GB Free of 40GB) and the usage status is illustrated with a colored progress bar. The color of the progress bar represents the status:
-
Green - OK
-
Yellow - Warning
-
Red - Error
The status indicator is displayed at several levels and is refreshed every hour:
|
Level |
Display |
Description |
Severity |
|---|---|---|---|
|
Tool |
Next to the tool name |
The overall status for all XMPie servers. |
The tool status severity is determined by the most severe status of one of its severs. |
|
Server |
Next to the server name |
The overall status for that server. |
The server status severity is determined by the most severe status of one of its disks. |
|
Disk |
Indicated by the progress bar length and color |
The disk space usage |
The disk space with respect to the pre-determined warning or error threshold. |
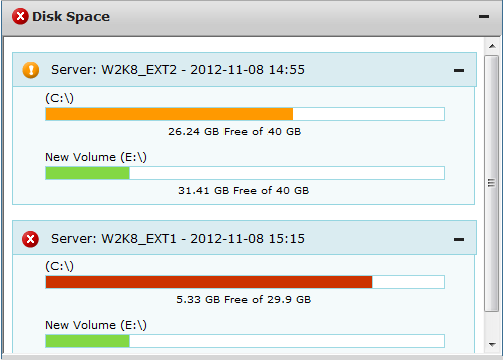
Example:
In the image below the first server has the Warning status since the disk C:\ has this status. The second server has the Error status due to the disk space error on the disk C:\. The Disk Space tool status is Error since this is the most severe status of one of its servers.
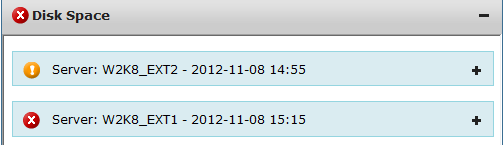
You can click the  button next to a server to display only the summary status:
Database size monitoring tool
The uProduce system requires a certain database size in order to function properly. The Database Size tool monitors the used database space to determine whether you need to increase its size or remove unneeded objects.
The database size monitoring is performed for each one of the XMPie databases. For each database the following information is indicated:
|
Option |
Description |
|---|---|
|
SQL Type |
The SQL Server type name (for example, SQL Server 2008 R2 Standard Edition) |
|
Instance |
The SQL Server instance to which the database is attached. |
|
Edition |
The SQL Server edition (for example, Standard or Express). |
|
Version |
The SQL Server version number. |
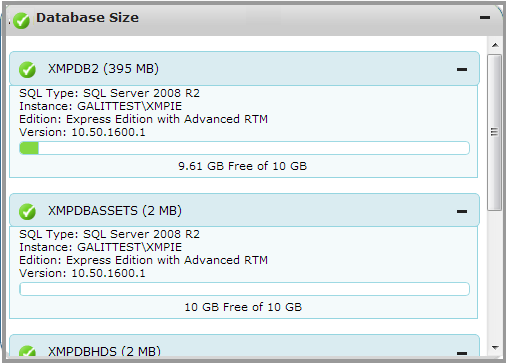
The Database Size monitoring tool notifies you about the amount of available database size and issues alerts when the minimum database size threshold is reached.
-
Warning: 25% of database size remains available.
-
Error: 15% of database size remains available
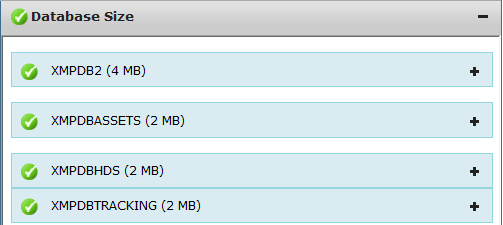
The status indicator is displayed at several levels and is refreshed upon the Monitoring page load.
|
Level |
Display |
Description |
Severity |
|---|---|---|---|
|
Tool |
Next to the tool name |
The overall status for all XMPie databases. |
The tool status severity is determined by the most severe status of one of the monitored databases. |
|
Database |
Next to the database name |
The database status. |
The database size with respect to the pre-determined warning or error threshold. |
You can click the
button next to a server to display only the summary status:
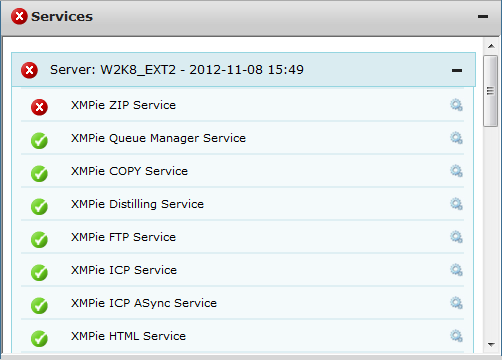
Services monitoring tool
The Services monitoring tool displays the status of XMPie services for each XMPie server. If a service stopped running, it is automatically marked with an Error status and an email notification is sent to the administrator. There is no Warning status for this tool.
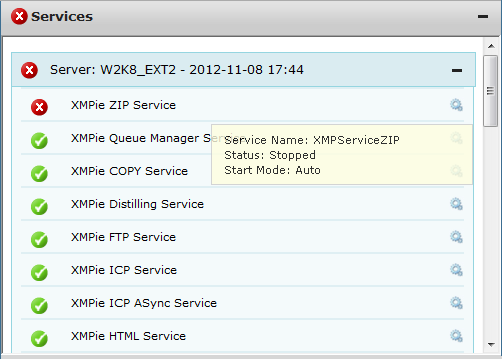
To display detailed information about the service, hover over the Status icon. The following tool tip is displayed:
|
Option |
Description |
|---|---|
|
Service Name |
The name of the XMPie service. |
|
Status |
Running or Stopped. |
|
Start Mode |
The manner in which the service is started: Auto: Service to be started automatically by the Service Control Manager during system startup. Manual: Service to be started by the Service Control Manager when a process calls the StartService method. Disabled: Service that can no longer be started. |
The status indicator is displayed at several levels and is refreshed every hour:
|
Level |
Display |
Description |
Severity |
|---|---|---|---|
|
Tool |
Next to the tool name |
The overall status for all XMPie servers. |
The tool status severity is determined by the most severe status of one of the monitored servers. |
|
Server |
Next to the server name |
The overall status for all services running on that server. |
The tool status severity is determined by the most severe status of one of the monitored services. If at least one service is stopped, the entire tool is marked with the Error status. |
|
Service |
Next to the service name |
The service status. |
A service that has been stopped receives the Error status. If you are not using that service, you can disable. |
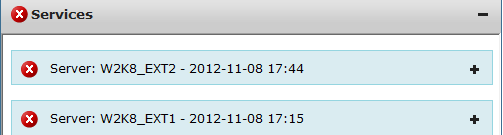
You can click the
button next to a server to display only the summary status: