Analytics
Video analytics includes a report that displays view progress events. Using this report you can assess the engagement of the viewer. For example, you can see the ratio of customers who got to the end of the video.
To view analytics of your project in the XVS dashboard, in the records page click the Analytics tab:
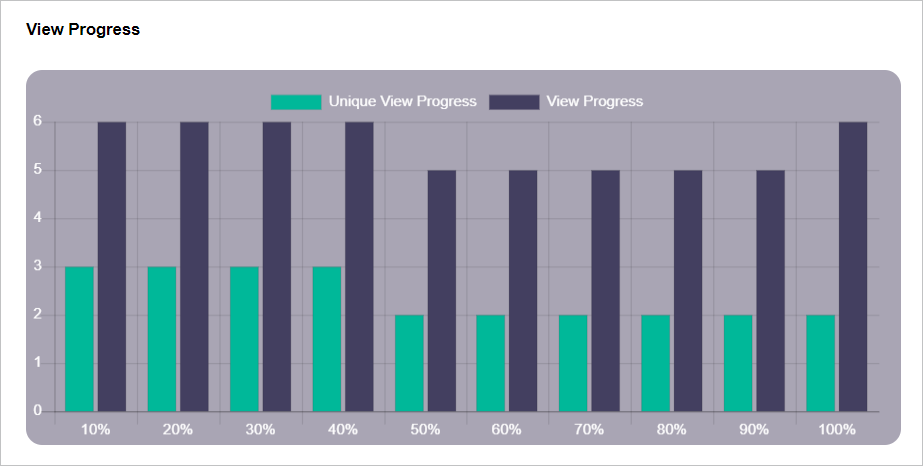
The View Progress report displays the total number of video views in 10 different segments throughout the video. E.g., if the video contains 100 seconds, the 10% segment represents second 0 through 10. The 50% segment represents second 40 through 50. The view of the segment is counted regardless of whether the viewer watched the entire segment or part of it.
Unique view progress: The number of recipients who viewed each video segment. The views are counted once per recipient for each segment, regardless of how many times the recipient viewed the video.
View progress: The number of views for each segment. This count is non-unique, counting multiple views of the same recipient.
Indication of viewed records
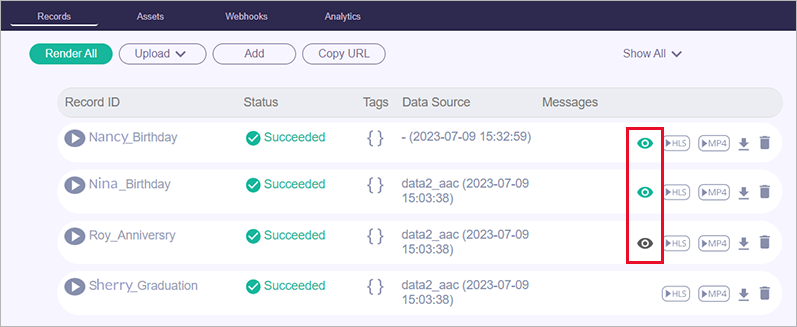
In the dashboard's record page, you receive an indication of which records have been viewed.
An eye icon appears next to each viewed record.
-
A green eye indicates that the recipient viewed at least 6 segments (or part of each segment).
-
A gray icon indicates that the recipient viewed between 1 to 5 segments.
-
If no icon appears, this means that the recipient did not view the video.
Unique visits
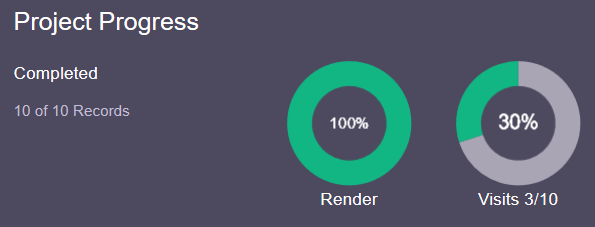
The Visits chart shows for each project the number of unique playbacks of video records.
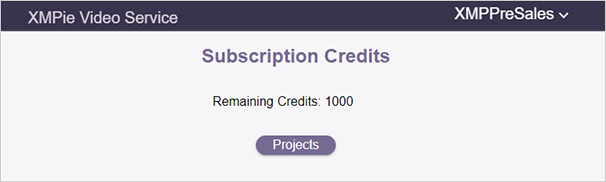
Remaining credits
You may view how many rendering credits remain in your subscription.
At the top right-hand corner of the screen click your username, and from the menu select Credits.
Analytics webhook
The Analytics webhook triggers an API for each analytic event that is written to the XVS database. For example, whenever the 10% segment event is written, a webhook event is triggered which sends the event to a 3rd party application, such as Google Analytics.
For more information, see Define webhooks.