Circle Analytics
Circle Analytics includes predefined, out-of-the-box reports available for your touchpoints. Using Circle Analytics, you can test and measure campaign results to better understand customer behavior and maximize campaign effectiveness, and decide on the next steps in your marketing strategy. For example, you can identify the peak performance time and the best performing links in an email.
Circle Analytics reports are available for new projects as well as for existing ones.
Analytics of a touchpoint can be shared with people outside the scope of Circle. Customers do not need to log into Circle or be Circle users in order to view analytics of their campaign. It is possible to provide them a direct link to analytics by placing it in any correspondence or third-party dashboard, to make it easily accessible by others. When the customer clicks the link, it opens the analytics in a browser window (desktop or mobile), independent of Circle.
Access Circle Analytics
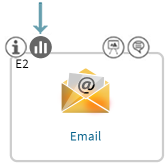
Click the Analytics icon above the touchpoint to view the analytic reports for that touchpoint:
Analytics window
The following is the Circle Analytics window for an email touchpoint:
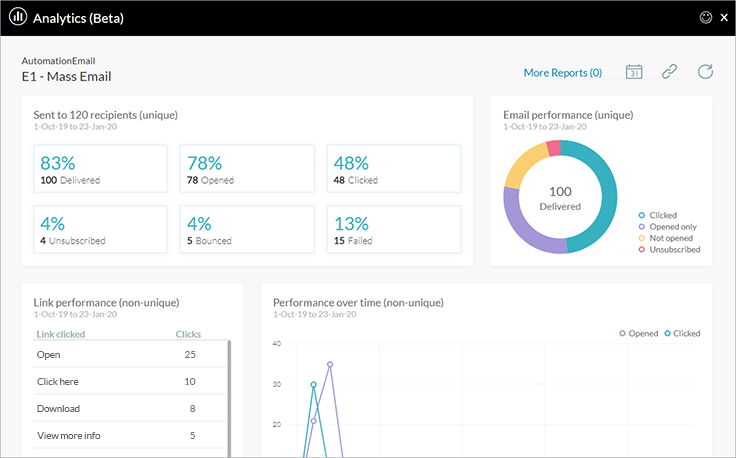
Title
Shows the project name and the touchpoint name. You can
force generation at any time by clicking the refresh  button.
Date filter
Set a date filter to impact the data displayed in the Analytics window. For example, limit data in the reports to show events which occurred during a certain time period (last week, month), or define a custom date range of your choice.
Copy link
Since Circle Analytics works as a standalone application, you can create a link to it that can be shared with others. The link is valid for a year. You may choose whether to allow the recipient of the link to download list reports.
More topics
Watch videos
Circle analytics email reports